Dashboards & Reporting
Instant Insights with Every KPI at Your Fingertips
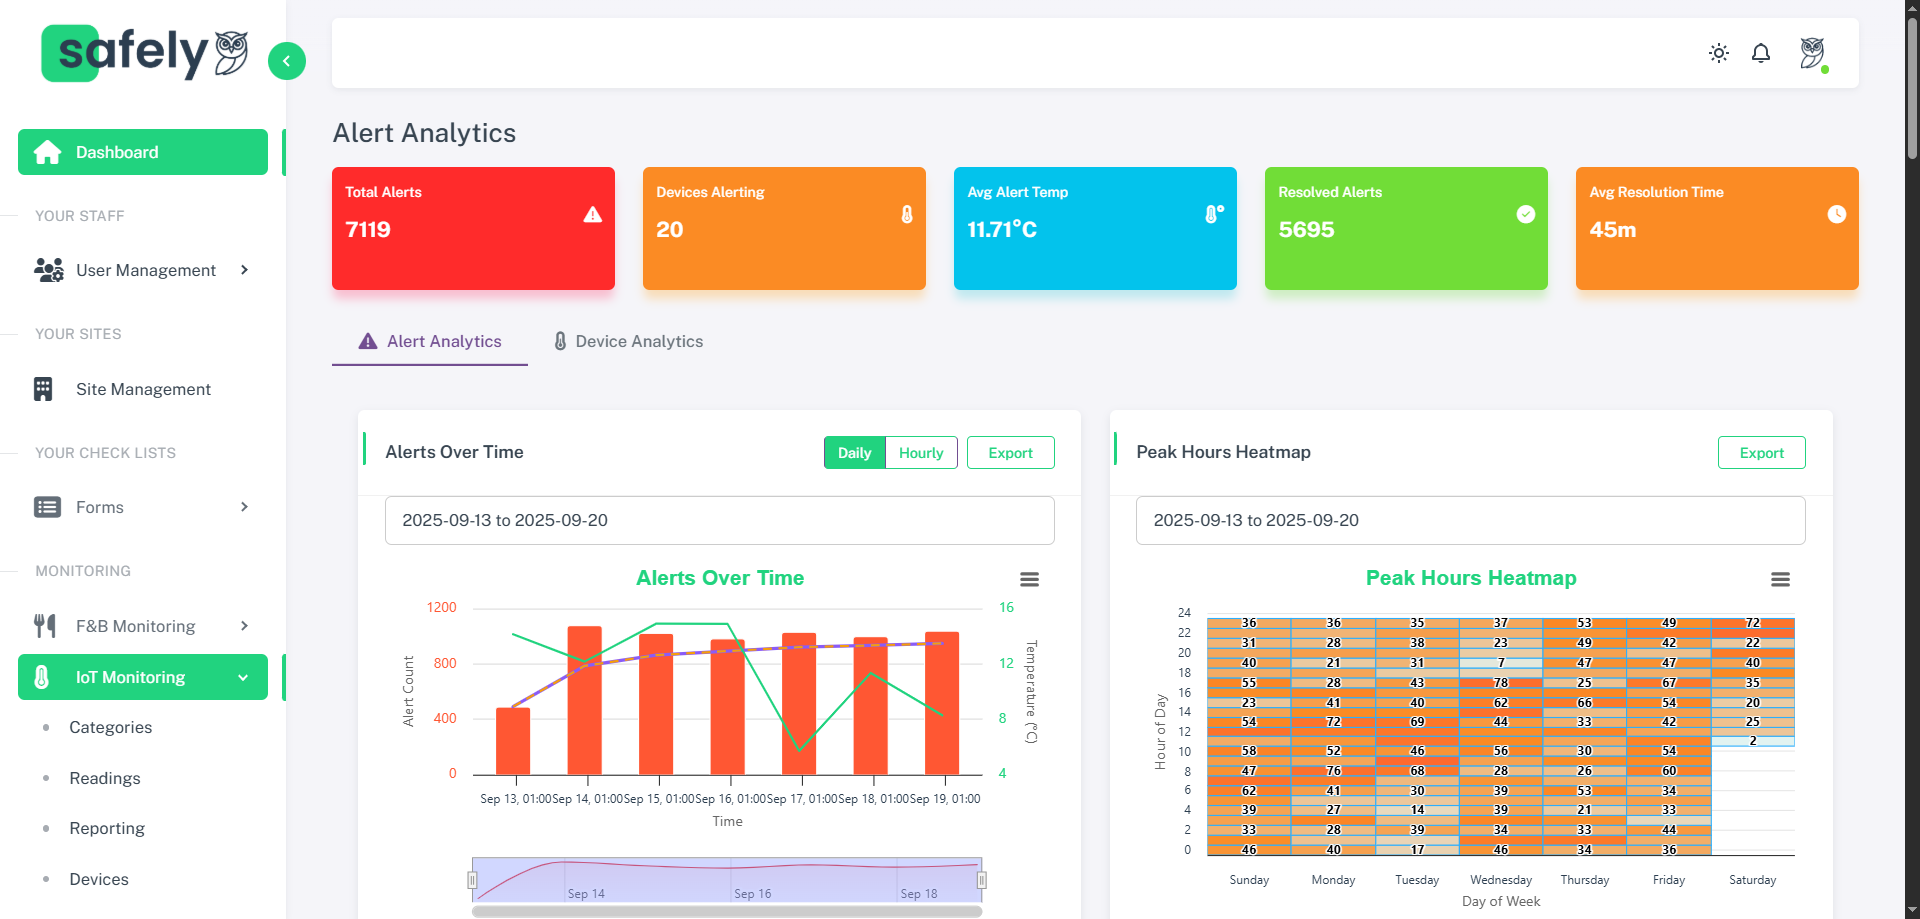
Turn complexity into clarity with Safely’s dashboards. From live operational data to historic performance analysis, our platform transforms raw information into actionable insight. Every KPI, every site, every team — all visualised in real time, so you can spot risks early, drive efficiency, and stay audit-ready with confidence.
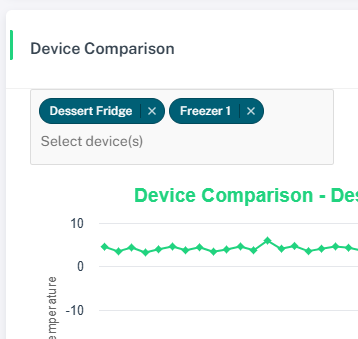
Live Data Visualisation
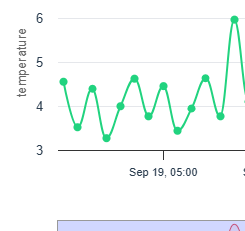
Up-to-the-minute stats, graphs and heat maps
Custom KPI's
Tailor dashboards to your unique priorities
Drill-Down Analytics
Click into data points for a more detailed view
Dynamic Filtering
Slice and dice data by various different filter options
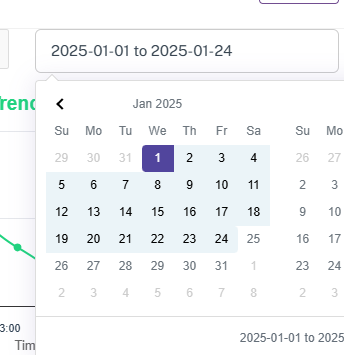
Historic Data Analysis
Review performance over any time period
Data Integration
Pull in external data (e.g. HR, POS, PMS) for a unified view
Turn Everyday Operations Into Real Time Intelligence
Safely’s powerful dashboards bring together data from across your operations — forms, sensors, staff activity, inventory, and incidents — into a single, visual interface. Whether you’re monitoring compliance, spotting underperforming sites, or tracking team productivity, Safely gives enterprise leaders the clarity they need to make fast, informed decisions. From multi-site benchmarking to energy analysis and audit preparation, it’s not just data — it’s action-ready insight.
Compliance Monitoring
Real time oversight of compliance performance
Safely provides a centralised compliance dashboard where managers can instantly view form pass/fail rates, non-conformances, and incident logs. This enables leadership teams to identify areas of concern, intervene before issues escalate, and ensure that regulatory standards are consistently upheld across all locations.
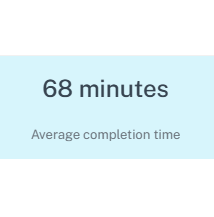
Team Performance
Monitor task execution, accuracy and staff trends
Track who’s completing their tasks on time, who’s resolving issues efficiently, and where errors or delays are occurring. Safely gives operational leaders the visibility to reward high performers, identify knowledge gaps, and tailor training — helping to build a high-performance culture.
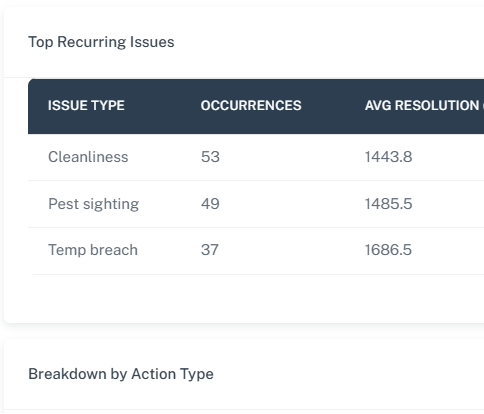
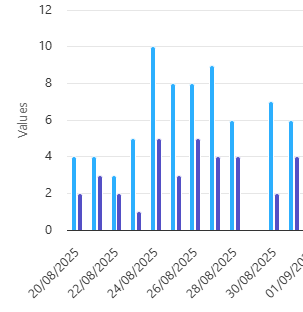
Food Safety Trends
Identify repeated risks and take preventative action
Track recurring temperature breaches, cleaning gaps, or form failures. Safely aggregates this data into trends, helping quality leads and compliance managers proactively address systemic issues and avoid repeat incidents — before they become costly or reputationally damaging.
Corrective Action Oversight
Fully visibility of open, closed and missed actions
Every non-compliance event or failed check can trigger a corrective action in Safely. You can see who’s assigned, what’s been resolved, and what’s overdue — helping managers follow up quickly, close the loop, and demonstrate strong governance to stakeholders and regulators.
Energy & Waste Analysis
Track utility usage and identify cost reduction opportunities
Gain insights into refrigeration losses, overconsumption, and operational inefficiencies contributing to rising energy and waste costs. Safely’s dashboards highlight trends in temperature deviations, equipment overuse, and excess waste — allowing you to take focused actions that drive down costs and support sustainability goals.
Audit Ready
Prepare for inspection without the stress
With all compliance data digitised and centralised, audit preparation becomes a matter of minutes — not weeks. Safely auto-generates documentation and stores historic logs, forms, certificates, and corrective actions in one place — giving inspectors exactly what they need, when they need it.
Stock & Inventory Insights
Analyse inventory and waste by location
Track what’s in stock, what’s nearing expiry, and where operational patterns might be driving waste. Safely helps teams fine-tune supply decisions, reduce overstocking or spoilage, and optimise production based on real-time availability and usage patterns.
Incident Mapping
Geo-tagged insight into recurring incidents
Use heat maps and trend visualisations to locate where issues — like guest accidents, food complaints, or allergen incidents — most frequently occur. Safely enables managers to focus on problem areas and implement changes that prevent future incidents.
Choose Your Plan
Start with a 7-day trial
All prices exclude VAT
Software Only
- Complete access to our full software platform
- Secure, cloud-based solution with automatic data backup
- 24/7 customer support portal access
- Dashboard reporting
- Unlimited user accounts
- Unlimited user accounts
- One device license included
- Customisable checklist templates
- Customisable checklist templates
- Unlimited checklist creation
- Optional add-ons including AI, IoT, platform configuration and training available
Software with IoT
- Includes everything in the Software Only plan, plus
- 24/7 priority support
- IoT device integration and configuration
- Hardware supply and setup
- Dedicated account manager
- Advanced IoT data analytics and reporting
- Platform configuration support
- Ongoing hardware maintenance and remote diagnostics
- Optional AI enhancement, training and optimistation support
FAQs
Q: Can dashboards be customised for different roles?
A: Yes, each user can have tailored views based on their needs.
Q: Is data exportable?
A: All dashboards support CSV, PDF, and automated email export.
Q: Can I schedule automated reports?
A: Yes, reports can be scheduled for automatic delivery to your inbox.
Q: Are dashboards updated in real time?
A: Yes, all data is live and updates instantly as new information comes in.
Q: Can I compare performance across multiple sites?
A: Absolutely—multi-site comparison is built in for benchmarking and analysis.
Q: Are there mobile dashboards?
A: Yes, you can access all dashboards and reports from any device, anywhere.
Q: How secure is my dashboard data?
A: All data is encrypted, securely stored, and accessible only by authorised users.
Q: Can external data sources be integrated?
A: Yes, dashboards can incorporate data from other systems such as HR or POS.
Q: Can we share dashboard views with auditors or external partners?
A: Yes, dashboards and reports can be securely shared or exported as needed.